

PlayStation, Console Prices Power Up
PlayStation, Console Prices Power Up
Supply chains move fast - let’s get ahead! Today we power up the PlayStation, subsidize China’s semiconductors, and adjust the EU’s carbon scheme. Tomorrow we’ll relax with supply chains.

PlayStation Powers Up, So Do Prices
Video game consoles should have been a big winner during the pandemic-era consumer boom. Supply chain constraints were the boss level that suppliers failed to beat. So, what does the latest data show?

Sales of video game consoles in the U.S. climbed 45% higher year over year in November according to NPD. A debottlenecking of Sony’s PlayStation 5 supply chain and higher prices reportedly drove the increase. That follows an announcement by Nintendo that it has cut its output forecast due to supply chain challenges.
There’s still evidence of supply chain shortages, with U.S. imports of videogame consoles falling in 2022 vs. 2021, as indicated by the blue line in the chart above. They fell by 18% year over year in the four months to Nov. 30, 2022. Note imports for November are based on the growth in seaborne shipments only.
The average import price per console has increased significantly (orange line above), rising by 60% year over year in the four-month period to reach $170 per machine. That likely reflects the increased share of PlayStation consoles, which retail at $400 to $500, vs. the lower-priced Nintendo Switch (around $200).

Console supply chains are also in a state of flux. The share of U.S. imports from China fell to 98% in the 12 months to Oct. 31 from 90% in 2018. That partly reflects Nintendo’s reshoring of some Switch console production to Vietnam.
The use of air freight has also varied during the pandemic era. Airfreight accounted for 45% of shipments in 2020 and 2021, as shown above. Manufacturers have sought to address elevated demand, staff shortages, and semiconductor constraints. The airfreight share has fallen to 31% in 2022 as supply chains relax and no new models have come to market.
Technology - Altogether Now
The Japanese government is reportedly in talks to join the U.S. push to prevent shipments of advanced semiconductor manufacturing equipment to China. The U.S., Japan, and the Netherlands - which is also in discussions - together account for 60% of global equipment, component and materials exports in 2021, per UN Comtrade data.
The Chinese government has appealed against recent U.S. semiconductor export restrictions at the World Trade Organization. The process will take months, and even then a final decision could be ignored by the U.S. (see Commodities below).
China’s government will reportedly launch a one trillion yuan ($143B) set of subsidies to support R&D and manufacturing of semiconductors in China. They’re designed, in part, to tackle restrictions by the U.S. and its partners on the export of advanced technologies.
There are already signs of those restrictions biting, with Alibaba reportedly struggling to source the latest Neoverse chips from Arm due to export license refusals.
The challenges will likely widen, with the U.S. adding YMTC and others to its “Entity List” of firms whose purchases from the U.S. are restricted.
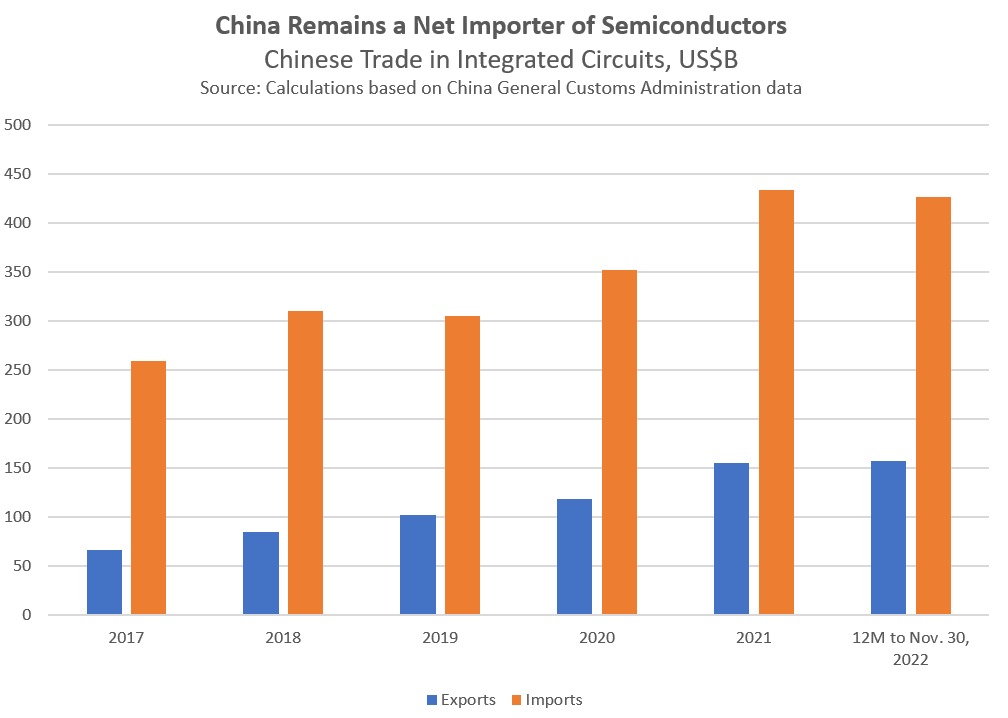
The expansion of China’s semiconductor manufacturing capacity versus its needs can be see in a comparison of exports and imports. As indicated in the chart above, China’s imports of semiconductors were 2.7x its exports in the 12 months to Nov. 30, 2022, down from 3.9x in 2017.
That still left China needing to import a net $269B per year of semiconductors in the 12 months to Nov. 30, 2022. The details are, of course, more complex given the diversity of semiconductor types.
Industrials - Feeling Deflated

U.S. import prices fell by 0.6% in November versus October, marking the fifth straight decline. Excluding energy, prices fell by 0.4%, the seventh straight drop. All the major categories across consumer goods, autos, and industrial supplies fell, while food increased by 1.8%. Annualized inflation of 1.9%, excluding energy, was the slowest since December 2020.
The slide in import prices, excluding energy, has yet to be seen further downstream in supply chains. Producer prices (final demand) and consumer prices excluding energy have continued to increase, as shown in the chart above.
The strength of the dollar has likely played a part, making it cheaper for American firms to import manufactured goods from Asia and Europe. Commodities - particularly energy - which tend to be priced in dollars, have gotten cheaper. The weakening dollar since the start of November may reverse that process, if sustained.
China has started to relax its COVID-19 restrictions. That could reduce bottlenecks in supply chains, most recently seen in smartphone production. Yet, there is the risk of increased illness-related absences which could degrade manufacturing capacity in the next few months.
There’s also the potential for reduced medical supply exports if domestic needs surge. China’s exports of medical products, ranging from pharmaceuticals to PPE, have fallen by 45% year-to-date and by 54% in October alone.
There’s already some evidence of shortfalls in Europe, specifically around generic drugs and their packaging.
U.K. manufacturing output may fall by 3.2% year over year in 2023 after a 4.4% drop in 2022 according to the Make UK association. Production in the electrical and mechanical engineering sectors are expected to fall fastest. Autos may expand as supply chain bottlenecks globally continue to ease.
A Barclays survey of British manufacturers shows that around 70% of firms are still suffering some form of supply chain disruption. The most exposed sectors are steel and chemicals, with incomplete inventories equivalent to 19% and 11% of revenues respectively vs. an average of 5% for all manufacturers.
The survey also found 39% of firms now hold higher inventories than before the current round of supply chain disruptions, while 37% have increased the number of suppliers.
A Deloitte survey of over 120 North American CFOs has found just 15% see supply chain issues as being a top priority in 2023. Cost management, at 52%, was the most focused-upon topic.
The major automakers are using the shift to electric vehicles to launch a series of restructuring measures in their manufacturing operations.
Stellantis will close a Jeep factory in Illinois in order to save costs to be invested in electric vehicle manufacturing. plant halt to save costs for EVs
Mercedes Benz has struck a deal with the Thai government to receive preferential import terms for its electric vehicles in the short term. In return, the firm will start assembly of the vehicles there in the longer term. That follows BMW’s plans to set up manufacturing in Vietnam.
Ford has added a third production shift to the production of its F-150 Lightning electric truck. Demand for the vehicle has reportedly exceeded expectations, requiring a scaling up of its supply chain. The latter has included ongoing investments at its factory in Michigan.
Panasonic Energy will provide batteries to EV-maker Lucid to support the manufacturing of its Air and Gravity vehicles in the U.S. Initially supplies will come from Panasonic’s Japanese operations, before the firm scales up its battery production in the U.S.
Exports of autos helped Japan’s exports increase by 20% year-over-year in yen terms. Shipments of autos climbed by 39% in yen terms, though the number of vehicles exported only rose by 11%. The weakness of the yen versus the dollar helped exports by 25%, with the dollar value of total exports from Japan down by 4% - the eighth straight decline.
Japan’s imports climbed by 30% in yen terms. Half the growth came from a 61% rise in imports of fuels (oil and gas), as a result of commodities generally being priced in dollars. In dollar terms, import growth of 4% was the slowest since January 2021.

China’s Comac has delivered its first C919 narrow-bodied jet. The jet, which costs $99M per plane, compares to the Airbus A320 and Boeing 737 which each cost around $110M. Sales of the C919 will initially be focused on domestic buyers rather than export markets.
The jet reportedly relies heavily on a wide range of overseas suppliers. That may lead to a significant expansion in China-inbound supply chain volumes as Comac starts to deliver its 1,115 orders. Domestic production may reduce China’s imports of jets.
The changing shape of China’s aerospace trade can be seen in the chart above. Imports of completed jets in the 12 months to Oct. 31, 2022, were 69% lower than in 2017. Shipments of parts and engines meanwhile rose by 154% and 21% respectively.
The important caveat is that the pandemic has also changed the nature of airlines’ demands for maintenance vs. new planes.
The initial round of U.S.-led Indo-Pacific Economic Framework discussions focused on “Pillar 1” issues including trade facilitation and environmental issues. The IPEF is unlikely to yield a traditional free-trade deal.
Approval of measures by the U.S. Congress may also be complicated by the Biden administration not having Trade Promotion Authority. Talks will likely continue throughout 2023.
Commodities - Adjusted Adjustment Mechanism

The EU’s Carbon Border Adjustment Mechanism has taken a step closer to fruition. An agreement was reached between member states and the European Parliament on CBAM’s implementation.
Initially, CBAM will cover aluminum, cement, electricity, fertilizers, hydrogen, and iron / steel. An earlier plan to include organic chemicals, plastics, and ammonia appears to have been adjusted. Both direct and indirect emissions will be included.
In simple terms, the CBAM will operate like a tariff on imports of the covered products - including some precursors and downstream products - from countries whose carbon pricing / taxation schemes are weaker than the EU’s. Importers must start reporting their data from October 2023, though the date for presenting permits has yet to be formalized.
The blue bar in the chart above shows the share of EU imports of CBAM products by origin for 2021, sourced from UN Comtrade. China and Russia are the largest contributors, accounting for 15% and 12% of total CBAM imports respectively. China leads in iron/steel (17%) and aluminum (15%) while Russia leads in fertilizers (30%).
The countries that are most exposed to CBAM in terms of CBAM products’ share of total EU imports from that country (orange bar above), among the top dozen suppliers, are Ukraine and Canada at 34% and 20% respectively. For Russia the ratio is 10% while for China it is just 4%.
The outcome impact of CBAM will likely be smaller than the figures above indicate. The war in Ukraine has altered trade flows. The presence of trade deals, bilateral negotiations, power generating mix (for indirect emissions), and existing carbon trading schemes all matter.
The EU has signed a deal with Chile that will allow Chilean firms to sell copper or lithium at a reduced price to EU buyers if Chilean processing facilities are used. The EU accounted for just 7% of Chilean lithium exports in the 12 months to September 2022, compared to 52% headed to China and 27% to South Korea.
EU Member States have approved the Commission’s proposals for the ninth set of sanctions against Russia. The current set includes more export restrictions on civilian chemicals, electronics, and mechanical components that have military dual-uses.
India’s oil companies are reportedly buying from Russian suppliers under the newly launched G7 price cap scheme. That comes despite prior statements from Russia that such sales would not be permitted. Russia accounted for 18% of India’s oil imports in the three months to Oct. 31, 2022, vs. 2% in the same period a year earlier.

U.S. solar power installations fell by 17% year over year in Q3’22 according to SEIA data. That reflects supply chain bottlenecks caused in part by “detainments under the Uyghur Forced Labor Prevention Act” of imports from China. Looking ahead, growth of over 20% annually is expected by SEIA thanks to subsidies provided by the Inflation Recovery Act.
The U.S. Commerce Department has ruled that certain imports of solar cells and modules from Cambodia, Malaysia, Thailand, and Vietnam used parts from China to circumvent tariffs applied against imports of completed products from China.
There’s been a steady shift in the sourcing of solar panels into the U.S. over the past decade, as shown in the chart above. China fell from 58% of imports in 2011 to near zero by 2018. Malaysia took up much of the slack, reaching 40% by 2019 and then falling to 21% in the past 12 months. Most recently, Vietnam has come to dominate with a 32% share.
The WTO has ruled that U.S. Section 232 (aka national security) tariffs on imports of steel and aluminum were not “taken in time of war or other emergency in international relations." They are therefore not justified and should be removed per WTO rules.
The U.S. has stated it “will not cede decision-making over its essential security.” That casts doubt not only over the tariffs themselves but also on the U.S. position regarding WTO rulings more broadly.
Disclaimer: This report is for information purposes only, not for legal, business, or financial decisions. It’s based on the latest available information on the publication date - that information may have changed by the time you read this report. Use it at your own risk.