

Fitter Athleisure
Fitter Athleisure
Supply chains move fast - let’s get ahead! Today, we’ll source some yoga pants and have a special gas relationship. ICYMI, take a look at Friday’s report for a discussion of Apple’s supply chain.

Consumer Goods - Resizing Athleisure Supply Chains

Sports and leisure apparel retailer Lululemon’s Q3 revenues increased by 28% year over year while inventories rose by 85%. The resulting inventory-to-sales ratio of 0.94x is the highest since Q1’20 and well above the 2011-2019 Q3 average of 0.62x. The firm “believes its inventories are well positioned to support its expected revenue growth” in Q4.
Global sourcing of athleisure-type clothing, based on eight product groups at HS-6, has steadily shifted over the past decade. As the chart above shows, sourcing from China has fallen from around 40% in the early 2010s to 22% in 2021.
Instead, suppliers have headed for lower-cost markets including Bangladesh and Vietnam, while Europeans and U.S. buyers may be near-sourcing to Turkey and Central America respectively.

Sourcing athleisure clothes specifically into the U.S. has three characteristics worth noting:
Slow import growth of 2% year over year in Q3’22, suggests slowing demand / elevated inventories (see Lululemon above), making a focus on costs more important than ever.
Risk management needs careful attention. China accounted for 20% of U.S. imports in the 12 months to Sept. 30 and currently faces zero-COVID challenges. Vietnam, which represented 15% of imports, already suffered a round of COVID-19-related closures in 2021. Bangladesh, 12% of imports, has had to deal with the pandemic, extreme weather, and strikes.
Chinese supplies to the U.S., as shown in the chart above, are used to meet seasonal needs with a normal peak in the July to September period for imports. In 2021 deliveries came later than usual, likely due to logistics disruptions, while the 2022 peak was earlier. It’s not clear whether other supplier centers can offer such variable supplies.
Stitch Fix delivered a 22% drop in revenues in the quarter to Oct. 29, 2022. Looking ahead, the firm has found that “high levels of inventory are impacting pricing with deeper discounting across the retail industry.” The firm’s own inventory strategy involved cutting orders for clothing in the quarter ending July 31, which will lead to lower deliveries in the coming six months.
Vans and North Face brand owner VF Corp has cut its revenue guidance for the coming year to reflect “a more elevated than expected promotional environment as well as order cancellations in the wholesale channel to manage trade inventories.”
There are conflicting claims about U.S. retail activity on Black Friday. New data from NPD suggests store spending was down by 5% year over year in the week ending on Nov. 27, and by 9% versus the same period of 2019. Earlier estimates from NRF and Adobe indicate stronger figures.
Official U.S. retail sales for November, due on a preliminary basis next week but in detail only in mid-January, may provide a truer picture.
EU retail store sales excluding food fell by 2% sequentially in October on an inflation- and seasonally-adjusted basis. They reached their lowest since April 2021. Online sales dipped by 0.4% sequentially and by 3% versus October 2021.
Commodities - A Special (Gas) Relationship
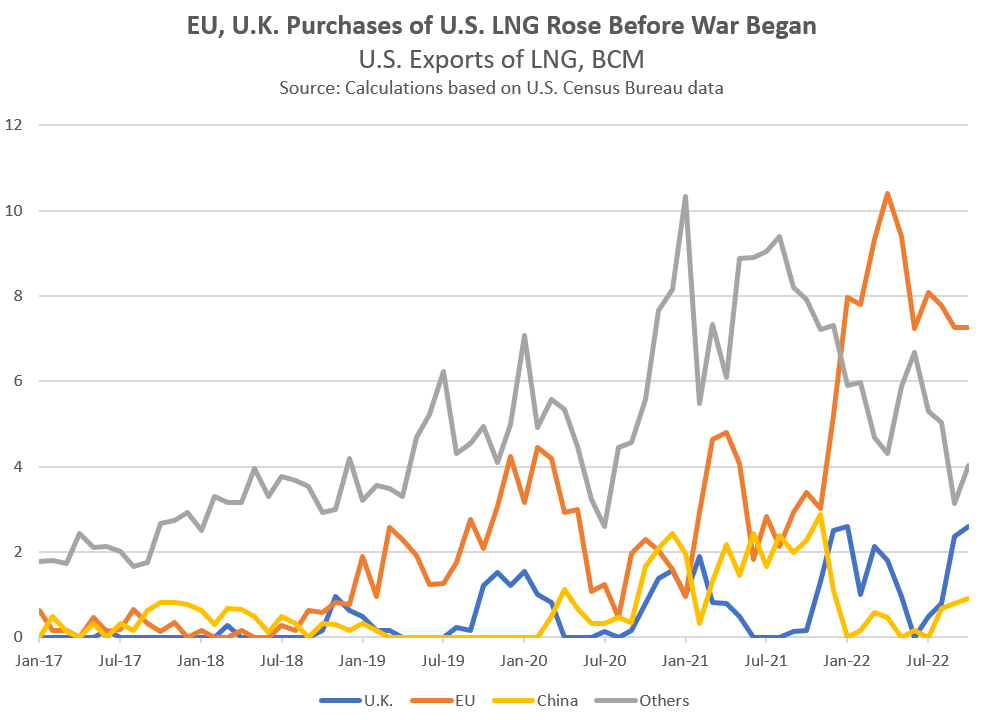
The U.S. and U.K. have announced an “energy partnership” to guarantee at least 10 billion cubic meters (bcm) of liquefied natural gas deliveries in 2023. That’s similar to a 15 bcm deal signed with the EU.
The sourcing of natural gas matters for supply chains through the vectors of industrial heat processes, petrochemical feedstocks, and consumers’ disposable incomes. The conflict in Ukraine has led both the EU and U.K. to reduce their reliance on Russian gas exports.
The chart above indicates that the U.K. already accounted for 18% of U.S. exports in October after shipments increased by 17x year over year. That compares to the EU’s 49% share in October after a 113% increase.
Total U.S. exports only increased by 8% in October due to the closure of Freeport’s terminal. The increased shipments to Europe came at the expense of reduced shipments to Asia, particularly China which had previously increased purchases as part of the “Phase 1” trade deal.
German utility EnBW will import 3bcm/year through the Hanseatic Energy Hub from 2027, having signed a 25-year deal. Notably, the facility is being built to import “green hydrogen”, a potential long-term, carbon-neutral alternative to natural gas.
The recently proposed EU natural gas price cap may be lowered and updated more frequently, following feedback from member states. As noted two weeks ago, the cap would only have been triggered a handful of times during 2022’s price volatility. A meeting of EU energy ministers on Dec. 13 may make a formal decision on the cap.
The G7 has implemented a ban on seaborne imports of crude oil from Russia. The group has also applied a cap of $60 per barrel for any volumes that use G7-domiciled shipping or insurance services.
The reach of the rules beyond G7 countries can be seen in Socar’s decision to not buy Russian oil for its Turkish refinery. Turkey is not a signatory to the ban or service restrictions.
The cap’s effectiveness globally may be limited. Non-G7 buyers, particularly India, can keep buying using non-G7 shipping services. Around half of the displaced oil could go to Asian markets according to one estimate.
Non-G7 shipping includes Russia’s, which also has a dark fleet - so named for vessels that switch off, or spoof, AIS satellite tracking.
The effectiveness is also limited by carve-outs. One example is Japan’s for oil sourced from the Sakhalin fields where Japanese companies have investments.
The debate now moves onto refined oil product supplies, such as diesel and gasoline. The EU plans a refined products embargo from February 5, with a subsequent 45 days grace period.
The OPEC+ group decided to leave production unchanged at its latest meeting. The next full meeting will be held in June 2023, but the group reiterated its “readiness to meet at any time and take immediate additional measures to address market developments and support the balance of the oil market and its stability if necessary.”
Despite all the supply-side turmoil, oil prices reached their lowest this year, reportedly reflecting expectations of falling demand heading into 2023.
The U.S. and EU may formulate a greenhouse gas-emissions-based tariff program for imports of steel and aluminum. An implementation is unlikely until late 2023 at the earliest, while the legal mechanisms are not immediately clear. There’s also the risk of a clash with other policies such as the EU’s Carbon Border Adjustment Mechanism.
On a simplistic basis 42% of U.S. steel and aluminum imports came from countries with which the U.S. has a trade deal in the 12 months to Oct. 31, according to U.S. Census Bureau data. The EU accounted for a further 11% while China, the reported target of the measures, represents 15%.
The WTO has reportedly ruled against U.S. Section 232, “national security” tariffs on imports of steel and aluminum. The appeal process is currently stalled due to a lack of quoracy on the appellate panel.
The EU Parliament and Council of member states have reached a political agreement to enact EC proposals on rules also looking to discourage deforestation. These will require corporations to perform due diligence on imports of cattle, coffee, cocoa, palm oil, timber, and rubber as well as derivative products from those materials.

The Indian government has expanded its export incentive program to include iron and steel products as well as chemicals and pharmaceuticals, including APIs. The assistance will be applied from Dec. 15, 2022, through Sept. 30, 2023.
India’s share of global packaged pharmaceuticals trade has increased steadily to 6.4% of exports (excluding intra-EU trade) in 2021 from 3.7% in 2011.
More recently Chinese exporters have increased their market share. As shown above, Chinese suppliers increased to 7.8% of U.S. imports in the 12 months to Sept. 30, 2022, while India’s have stalled at around 10.5%.
Industrials - Faster Cars

U.S. sales of autos and light trucks increased by 10% year over year in November, including foreign vehicle sales which rose by 17%. As shown above, imports have increased more rapidly than sales, rising by 39% in October (the latest available data). That may reflect a rebuild of inventories by dealers in excess of current sales, or increased availability for onward export.
Mexican auto parts manufacturing could increase by 13% year over year in dollar terms in 2022, according to an industry association. That likely reflects a mixture of inflation and recovery from supply chain disruptions. Growth is forecast to slow to 2% in 2023 and 1% in 2024.
BMW will start assembly of its 3, 5, X3, and X5 models in Vietnam. The firm will use containerized, completed kits rather than shipping finished vehicles for sale in the country. The strategy can optimize costs and ensure more reliable delivery schedules than using global car carriers.
Chinese automakers BYD and SAIC have orders in place for 13 new roll-on, roll-off car carriers. The vessels will be delivered over the next three years to enable the firms to build their electric vehicle export businesses.
China’s exports fell by 8.7% year over year in November, more than the 3.5% expected by economists. An 11% slide in imports was also worse than expected.
As noted in yesterday’s tech-focused SCC, exports of telecoms and semiconductors both dropped, while computer exports fell by 28%. Consumer products fell more broadly - textiles and furniture slid by 15% and 16% respectively - while commodities were the main bright spot as food and refined oil products rose.
U.S. exports fell by 1% sequentially in October on a seasonally-adjusted, nominal basis. A decline in food exports, likely linked to commodity prices, and pharmaceuticals were the main drivers. While imports in total improved by 1%, shipments of consumer goods fell by 1% including a 17% drop in smartphones (see yesterday’s SCC) and a 20% slide in toys.
The slowdown in imports may be accelerating. Total U.S. seaborne imports of containerized freight (paywall) fell by as much as 19% year over year in November.

Russia has continued to attack Ukraine’s power grid, extending an intensive bombardment started in mid-October and resulting in significant power outages. Rebuilding the grid will prove expensive and could take years.
As shown in the chart above, the value of international trade in large electrical transformers has fallen steadily over the past decade, from around $10B in 2010 to $7.5B in 2021. Exports from China and North America expanded by 38% and 22% respectively during the period, while those from the EU and South Korea have fallen.
The European Commission has proposed a ninth set of sanctions against Russia. These include new restrictions on dual-use chemicals and electronics as well as engine components for drones.
South Korea’s truck drivers voted to end their two-week strike. The government had already forced petrochemical and steelworkers back to strike.
The knock-on effect of the strike on global trade can be seen in container shipping rates. In the past two weeks, China-South Korea rates fell by just 0.5% versus a 10% slide in average rates for shipping ex-China. That may reflect an increase in bottlenecks at South Korea’s ports.
Disclaimer: This report is for information purposes only, not for legal, business, or financial decisions. It’s based on the latest available information on the publication date - that information may have changed by the time you read this report. Use it at your own risk.