

And, Relax
And, Relax
Supply chains move fast - let’s get ahead! Today we relax with supply chain data and deliver fewer consumer goods. ICYMI, yesterday we played with video games and adjusted a carbon scheme.

2022: The Year Supply Chains Relaxed
Have supply chain tensions relaxed in 2022? In five charts, we show that logistics evidence suggests they might have done, for the most part. Next week we’ll take a look at the broader issues that have driven supply chains in 2022.
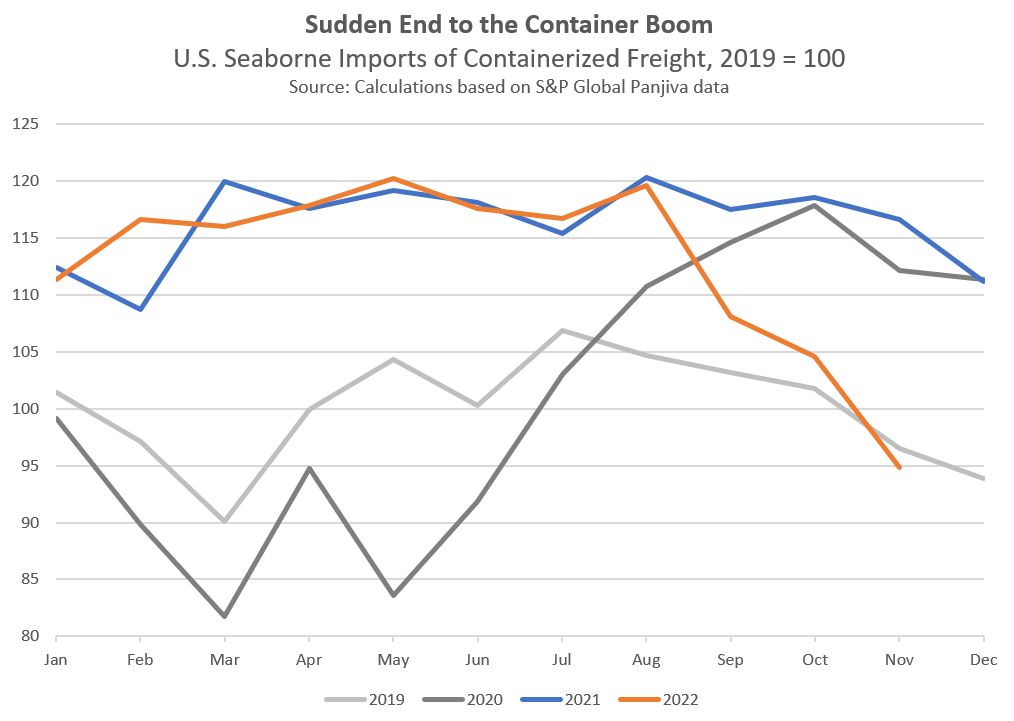
A defining characteristic of pandemic-era supply chains has been congestion in logistics networks. A boom in consumer spending (see more below) combined with COVID-19-linked absences (ocean freight) and travel restrictions (air freight) have clogged up what are effectively fixed-capacity networks.
The chart above shows that activity running through ocean logistics networks may have begun to slow. U.S. seaborne imports of containerized freight fell by 19% in November versus a year earlier and dipped by 2% compared to 2019. The latter was the first decline versus the same period of 2019 since July 2020.
Air freight volumes have also struggled to recover. As of October 2022, the total volumes handled were 14% lower than a year earlier and down by 6% compared to October 2019 according to IATA data.

Exports from the major Asian production centers have also reversed. The chart above shows the aggregate of exports, in dollar terms, from mainland China, Taiwan, South Korea, and Japan combined fell by 1% in October and 9% in November. The November fall was the fastest decline since May 2020.

The surge in consumer product demand, combined with a desire by retailers to avoid missed sales opportunities due to logistics bottlenecks, led to a surge in the utilization of warehouses.
As shown above, in data from WarehouseQuote, warehouse pricing in the U.S. soared through June 2022. Storage rates have since declined by as much 10% but still remain around 11% above the January 2021 level. That would suggest lessening, but not yet fully alleviated congestion.
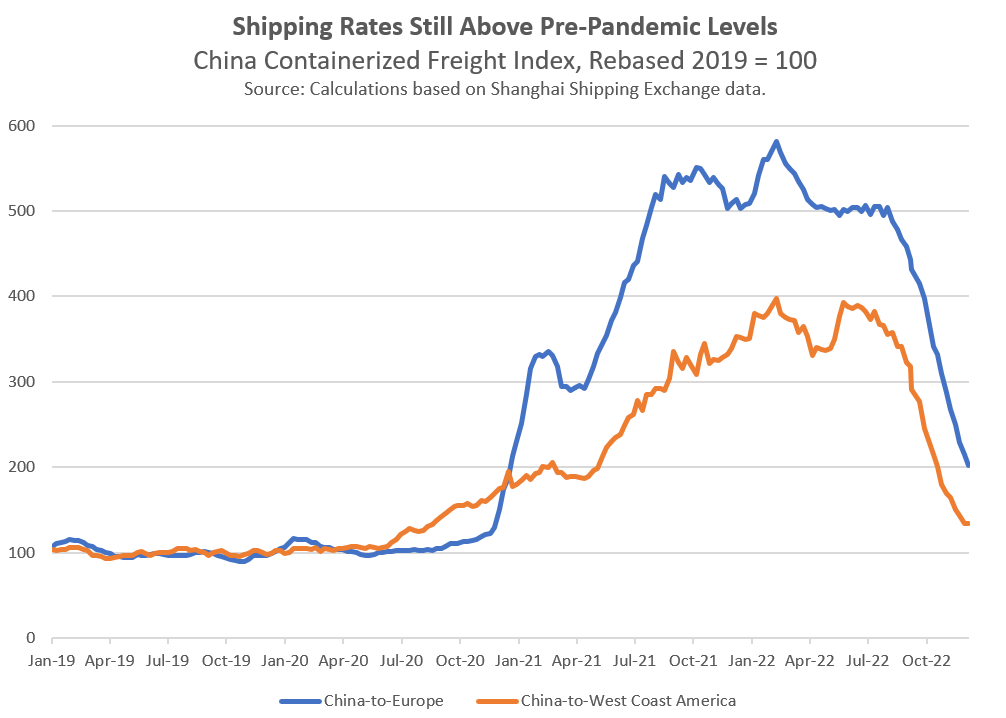
Perhaps the most visceral sign of logistics congestion has been container shipping rates. At their peak in February 2022, China-Europe rates were 5.8x their 2019 average level, while China-U.S. West Coast rates increased four-fold.
While rates peaked in February, the rot only set in from August. Since then both routes have fallen by around two-thirds. China-Europe rates are now at their lowest since December 2020, while China-U.S. West Coast is at August 2020 lows.
Shipping rates have fallen a long way, there could be more. The average for all routes ex-China is still 1.7x the 2019 average and 2.2x the April 2016 trough.
While above prior levels, costs may have increased too. Hapag-Lloyd’s CEO has stated, that he expects some shipping routes’ rates to “bounce back up again as well, because some of them are currently simply way below cost again.”
More broadly, U.S. producer prices for transportation, including trucking, rail, and air freight as well as maritime shipping, rose by 28% at the June 2022 peak from the 2019 average. Subsequently, they have declined by just 3%.
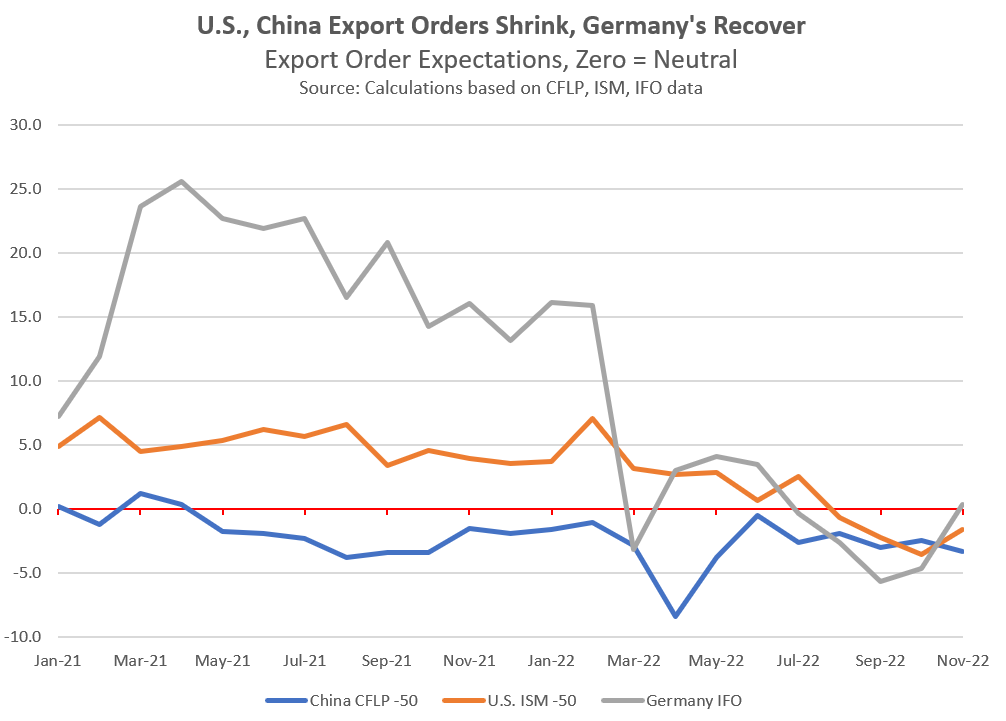
Looking ahead, business surveys indicate expectations that exports from China and the U.S. are in a state of decline, while those from Germany are only just in positive territory having been negative since July.
Consumer Supply Chains - Shipping and Shopping Early
U.S. retail sales fell by 0.6% sequentially in November on a seasonally adjusted basis. Consumer durables led the downturn, with furniture and electronics down by 2.6% and 1.5% respectively, while autos fell by 2.3%. The bright spots were food and healthcare, which increased by 0.8% and 0.7% respectively.
A new poll suggests 60% of American buyers will purchase fewer gifts, and 30% none at all, compared to last year. That comes even as consumer sentiment improved in December according to the University of Michigan survey.
The preliminary retail inventory-to-sales ratio meanwhile dipped to 1.22x in October from 1.24x. Given the decline in sales that likely reflects a faster drop in the sourcing of consumer goods.

Importers of consumer goods appear to have shipped early and then aggressively cut their shipments late in the peak season. The chart above shows U.S. seaborne imports of containerized freight for five consumer goods categories.
Imports of appliances and furnishings - major winners during the stay-at-home period of the pandemic - are down by 15% and 13% respectively in June-to-November in 2022 versus a year earlier (orange bars in the chart above).
Imports of leisure goods (toys and sports), electronics, and apparel are down by less overall but peaked much earlier in the year (blue and grey bars).
Shipments in all five categories were lower in November 2022 than they were in November 2019 by 2% (furnishings) to 27% (toys, sports).
U.K. retail sales fell by 0.4% in November versus October in volume terms, with e-commerce down by 4%. Sales by household goods stores dropped by 3.7% sequentially while apparel improved by 2%.
U.K. consumer confidence improved for a second month in November, according to GfK’s survey, but remains close to 50-year lows. The personal finance outlook improved to the best since July, but major purchase intentions only returned to September’s level.
U.K. merchandise imports increased by 26% year over year in November. Much of that was the result of commodity price inflation, with growth in real (inflation-adjusted) terms of just 3%. Among consumer goods, apparel and telecoms equipment grew by 40% and 45% respectively in nominal terms, while furniture and autos increased by 10%.

Pakistan’s currency shortage is reportedly hurting its ability to import raw materials, including pharmaceuticals, as well as capital goods. That may have a knock-on impact on global supply chains, particularly for finished goods.
The chart above shows that Pakistan’s leading exports in 2021 included apparel (30% of the total), textiles including cotton (12%), and agricultural products, led by cereals (14%).

The U.S. government has relaunched the distribution of free COVID-19 test kits. The original “Path out of the Pandemic” scheme had followed significant pressure on supply chains for such kits.
As shown in the chart above, U.S. imports of diagnostic materials (based on WCO classifications and U.S. Census Bureau data) ramped up in October by 50% year over year to the highest since March 2022.
The structure of sourcing has changed. China only represented 2% of the total in the three months to Oct. 31, 2022, down from 20% in Q1’22. Supplies are dominated by shipments from Europe with a recent surge in imports from Japan.
Disclaimer: This report is for information purposes only, not for legal, business, or financial decisions. It’s based on the latest available information on the publication date - that information may have changed by the time you read this report. Use it at your own risk.